A Beginner’s Guide to Reading Indoor Air Quality Data
Indoor air quality data can seem confusing at first. You may see values such as 550 ppm CO2, 42% humidity, 22°C temperature, or 8 µg/m³ PM2.5 and wonder what they actually mean. Is the air good? Is the room properly ventilated? Is there anything that needs attention?
For environmental scientists and indoor air quality specialists, these numbers are familiar. They understand the units, the acceptable ranges, and how different parameters interact with each other. But for general users, indoor air quality data is not always easy to interpret. Most people know when a room feels stuffy, too dry, too warm, or uncomfortable, but they may not know which air quality parameter is causing the issue.
This is why understanding the basics of indoor air quality data is important. We spend most of our time indoors — at home, in offices, schools, meeting rooms, healthcare spaces, gyms, shops, and public buildings. The quality of the air in these spaces can influence comfort, focus, sleep, productivity, and overall well-being.
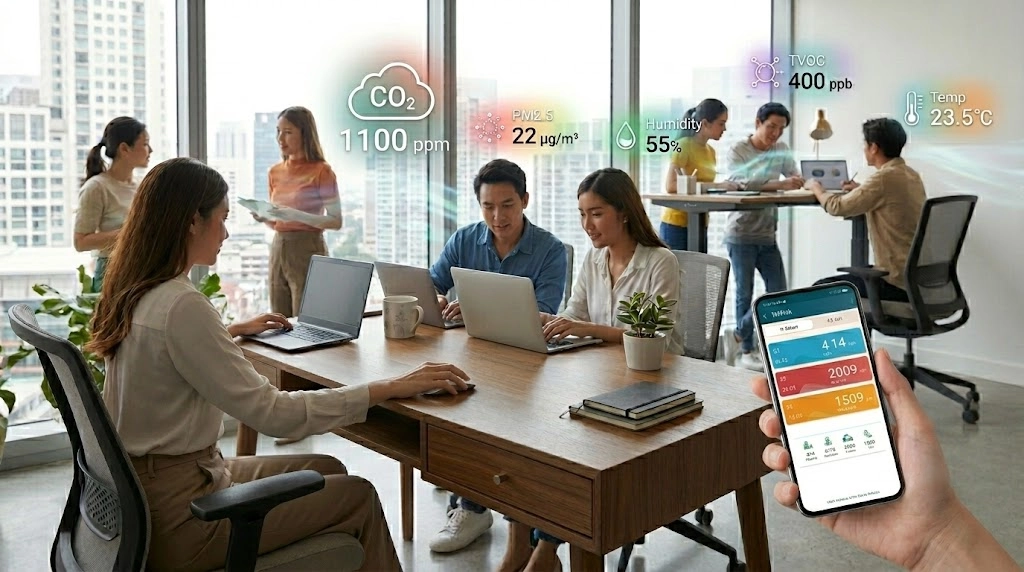
The good news is that you do not need to be an environmental expert to understand your indoor environment. With a smart indoor air quality monitoring device like HibouAir, key environmental parameters can be measured continuously and presented in a way that makes the data easier to understand.
HibouAir monitors important indoor environmental parameters such as temperature, humidity, pressure, VOCs, CO2, PM1.0, PM2.5, and PM10. Through real-time monitoring, mobile and desktop app access, cloud analytics, alerts, historical charts, air quality scores, and additional insights, HibouAir helps users understand how their indoor air is performing over time.
Understanding Common Air Quality Units
Different indoor air quality parameters are measured in different units. Understanding these units makes it easier to read the data and understand what the numbers mean.
CO2: ppm
CO2, or carbon dioxide, is usually measured in ppm, which means parts per million. A CO2 value of 550 ppm means there are 550 parts of CO2 in every one million parts of air.
CO2 is naturally produced when people breathe. In indoor spaces, CO2 levels often increase when more people are present or when ventilation is not strong enough. This is why CO2 is commonly used as an indicator of ventilation and occupancy.
For a general user, the key idea is simple: when CO2 rises indoors, the room may need more fresh air.
Particulate Matter: µg/m³
Particulate matter, often written as PM, refers to tiny particles floating in the air. HibouAir supports monitoring of PM1.0, PM2.5, and PM10.
PM1.0 refers to very small particles around 1 micrometer or smaller. PM2.5 refers to fine particles 2.5 micrometers or smaller. PM10 refers to inhalable particles 10 micrometers or smaller.
PM is usually measured in µg/m³, which means micrograms per cubic meter of air. The smaller the particle, the deeper it can travel into the respiratory system. This makes PM2.5 especially important when assessing indoor air quality.
For general users, the main point is that lower PM values are better, especially for fine particles such as PM2.5.
VOC: ppm
VOC stands for volatile organic compounds. These are gases that can be released from paints, cleaning products, furniture, adhesives, fragrances, building materials, and other indoor sources.
VOC readings may be shown in different formats depending on the sensor and platform. Some systems show VOC values in ppb, ppm, mg/m³, or as a VOC index.
For beginners, VOC data is useful because it can help identify changes in the indoor environment. A sudden rise in VOC levels may be linked to cleaning, painting, new furniture, air fresheners, renovation work, or other chemical sources indoors.
Humidity: %RH
Humidity is usually measured as relative humidity, shown as %RH. A value of 45% RH means the air contains 45% of the moisture it could hold at that temperature.
Humidity plays an important role in indoor comfort. Air that is too dry can feel uncomfortable, while air that is too humid can make the space feel heavy and may increase the risk of mold growth. In many indoor environments, a relative humidity range of around 30–50% is considered comfortable and practical.
For general users, the goal is to keep humidity balanced — not too dry and not too damp.
Temperature: °C or °F
Temperature is usually shown in °C or °F. While temperature does not directly tell you whether the air is polluted, it has a strong effect on comfort and how people experience an indoor space.
Temperature also interacts with other parameters such as humidity and ventilation. A room with acceptable air quality readings may still feel uncomfortable if the temperature is too high or too low.
For most indoor spaces, comfort often falls somewhere around 20–26°C, depending on the season, clothing, activity level, and personal preference.
Pressure: mbar
Air pressure may be shown in hPa, Pa, or mbar. For general users, pressure may be less familiar than CO2, humidity, or temperature, but it still adds useful context.
Pressure readings can help show environmental changes and may also support more advanced understanding of ventilation, airflow, and building behavior. In everyday use, pressure is often most useful when viewed as part of a larger environmental picture rather than as a single standalone value.
Good Indoor Air Quality Ranges for Common Indoor Parameters
The table below gives beginner-friendly guidance for the indoor parameters supported by HibouAir. These ranges are intended as practical reference points for general understanding. Actual requirements may vary depending on building type, local guidelines, health conditions, outdoor air quality, and specific use cases.
| Parameter | Unit | Beginner-friendly good range | What it means |
|---|---|---|---|
| CO2 | ppm | Around 400–800 ppm is good; below 1,000 ppm is generally acceptable | Higher values suggest the room may need more ventilation |
| PM1.0 | µg/m³ | As low as possible; ideally very low and stable | Fine particles should be minimized indoors |
| PM2.5 | µg/m³ | As low as possible; WHO annual guideline is 5 µg/m³, 24-hour guideline is 15 µg/m³ | Fine particles are one of the most important air quality indicators |
| PM10 | µg/m³ | As low as possible; WHO annual guideline is 15 µg/m³, 24-hour guideline is 45 µg/m³ | Larger inhalable particles may come from dust, outdoor air, movement, or activities |
| Humidity | %RH | 30–50% RH is a good target; keep below 60% when possible | Helps reduce mold risk and supports comfort |
| Temperature | °C | Often around 20–26°C for comfort | Comfort depends on clothing, activity, season, and personal preference |
| VOC | ppm | Lower is better; watch for sudden increases | High or rising VOC readings may suggest chemical emissions indoors |
| Pressure | mbar | No single “good” value for all rooms | Useful for understanding environmental context and changes |
WHO’s 2021 air quality guidelines include recommended levels for PM2.5 and PM10, including 5 µg/m³ annual PM2.5, 15 µg/m³ 24-hour PM2.5, 15 µg/m³ annual PM10, and 45 µg/m³ 24-hour PM10.
How HibouAir Helps Make Indoor Air Quality Easier to Understand
HibouAir is designed to make indoor air quality monitoring more accessible for general users, businesses, facility teams, schools, and organizations. Instead of relying on occasional checks or subjective feelings, HibouAir continuously measures key indoor environmental parameters in real time.
HibouAir can monitor CO2 for ventilation awareness, PM1.0, PM2.5, and PM10 for airborne particles, VOCs for chemical emissions, humidity for moisture balance, temperature for comfort, and pressure for environmental context. By collecting these values continuously, HibouAir helps users understand how their indoor environment changes throughout the day.
The mobile app that comes with HibouAir makes this information easier to access and interpret. Users can view live readings, check parameter values, and follow historical charts to understand how the indoor environment behaves over time. This helps turn technical measurements into practical information that general users can understand.
Data Logging for Long-Term Air Quality Understanding
HibouAir does not only show real-time indoor air quality data; it also logs data over a longer period of time. This stored data helps users understand trends, compare changes, generate reports, and perform deeper analysis. Real-time readings are useful for knowing what is happening at the moment, but long-term logged data gives a clearer picture of how indoor air quality changes throughout the day, week, or month.
Average Particle Measurement for Better Insight
For particle measurements such as PM1.0, PM2.5, and PM10, average values are especially useful. A real-time PM reading can show a sudden increase caused by cooking, cleaning, dust movement, or outdoor air, but an average value helps users understand the overall air quality condition over a selected time period. HibouAir’s smart analytical dashboard can provide 24-hour average values, helping users evaluate particle exposure more clearly instead of relying only on instant readings.
You Do Not Need to Be an Environmental Expert
Indoor air quality can be technical, but understanding it does not need to be complicated. The most important step is knowing what each parameter generally tells you.
CO2 helps explain ventilation and occupancy. Particulate matter helps identify airborne particles. Humidity shows whether the air is too dry or too damp. Temperature affects comfort. VOC readings help detect changes related to chemical emissions. Pressure adds useful environmental context.
With smart indoor air quality monitoring devices like HibouAir, these values are measured continuously and presented in a more understandable way. This allows general users to make better decisions without needing specialist knowledge.