
Read this post in
  • English
  • Svenska
  • HibouAir Introduces GO IAQS Historical Exposure Reports for Indoor Air Quality Assessment

    Indoor air quality monitoring becomes much more valuable when the collected data can be turned into something that people can understand, document and act on.

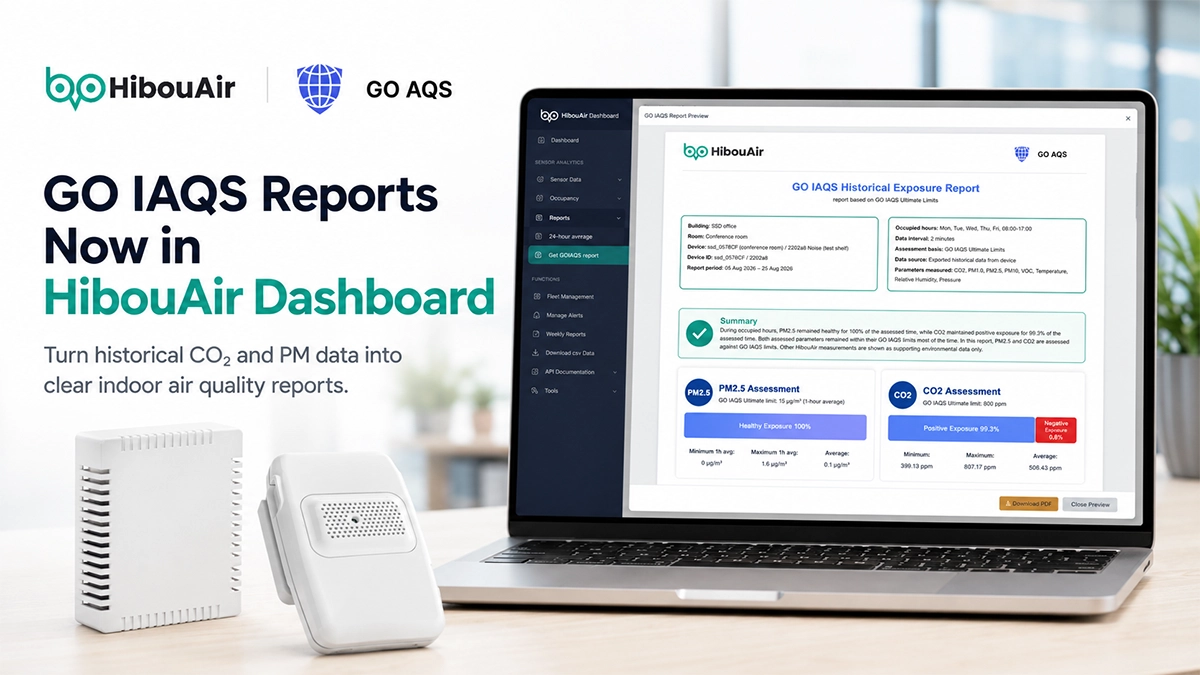
    HibouAir already helps users monitor indoor environmental conditions continuously and review historical trends through the dashboard. Now, a new GO IAQS Historical Exposure Report feature makes it possible to turn that historical sensor data into a structured report based on the Global Open Indoor Air Quality Standards (GO IAQS) framework.

    The new report is especially useful for facility managers, indoor air quality consultants, building operators, auditors, researchers and other professionals who need to document indoor environmental conditions over a defined period rather than simply look at live sensor values.

    What is GO IAQS?

    GO IAQS stands for Global Open Indoor Air Quality Standards. It is part of the Global Open Air Quality Standards initiative and provides a transparent, science-based framework for assessing indoor air quality.

    The framework includes different approaches depending on the purpose of the assessment. For historical reporting, GO IAQS uses its Ultimate Limits to evaluate how much time occupants were exposed to conditions below or above defined protective thresholds.

    Instead of presenting only a single air quality score, the historical report focuses on a very practical question:

    During the selected occupied period, how much time was the indoor environment within the recommended limit, and how much time was above it?

    The result is shown as a percentage of Healthy Exposure and Unhealthy Exposure.

    GO IAQS defines Healthy Exposure as time spent below the applicable protective threshold or limit, while Unhealthy Exposure represents time spent above it.

    This makes the result easier to understand than a large table containing thousands of individual sensor readings.

    Turning HibouAir Historical Data Into a Meaningful Report

    HibouAir continuously collects indoor environmental data and stores historical measurements that can be viewed through the dashboard.

    With the new GO IAQS reporting feature, users can select the monitoring device, reporting period, occupied hours and relevant days, and the dashboard processes the historical measurements into a structured GO IAQS report.

    For example, a facility manager may want to evaluate a meeting room during normal working hours rather than including nights and weekends.

    The report can therefore focus on a period such as Monday to Friday between 08:00 and 17:00. Historical measurements outside the selected occupied period are excluded from the assessment.

    This is particularly important because an indoor environment can look very different when a room is empty compared with when people are actually using it.

    Understanding PM2.5 Exposure

    Fine particulate matter, or PM2.5, is one of the main pollutants assessed in the GO IAQS report.

    Under the GO IAQS Ultimate framework, PM2.5 is assessed using a 1-hour average with a limit of 15 µg/m³.

    HibouAir devices normally collect measurements much more frequently than once per hour. The reporting system therefore groups the available PM2.5 measurements by hour and calculates an hourly average.

    Each hourly value is then compared with the GO IAQS limit.

    Hours with an average at or below the limit contribute to Healthy Exposure, while hours above the limit contribute to Unhealthy Exposure.

    The report also shows useful supporting information such as the average PM2.5 concentration and the highest hourly average measured during the selected period.

    This allows a user to understand not only the overall exposure percentage but also whether there were significant pollution peaks.

    Understanding CO2 Exposure

    Carbon dioxide is another important parameter in indoor air quality monitoring because it is widely used as an indicator of ventilation performance.

    The GO IAQS Ultimate framework uses a CO2 threshold of 800 ppm.

    In the HibouAir report, historical CO2 measurements are evaluated against this threshold during the selected occupied period.

    The report then shows how much of the monitored period remained within the recommended level and how much exceeded it.

    For a facility manager, this can reveal whether a room generally has sufficient ventilation or whether occupancy regularly causes CO2 levels to increase.

    A room may appear perfectly acceptable when viewed briefly during an unoccupied period while regularly exceeding the recommended level during meetings, lessons or other periods of high occupancy. Historical reporting makes those patterns much easier to identify.

    One Device or Two Devices Can Be Used

    Different HibouAir devices are designed for different monitoring requirements.

    A dedicated HibouAir PM device can monitor parameters such as PM1.0, PM2.5 and PM10, together with additional environmental measurements such as temperature, humidity and VOC.

    A CO2-focused HibouAir CO2 Device device measures CO2 together with environmental parameters such as temperature, humidity and VOC.

    For locations where both particulate matter and CO2 need to be monitored, the dashboard can generate the GO IAQS report using two devices together. The CO2 device provides the CO2 and general environmental measurements, while the particulate matter device provides the PM measurements.

    HibouAir Duo simplifies this further by combining CO2 and particulate matter monitoring in a single device. In this case, only one device needs to be selected when generating the report.

    This flexibility means the reporting system can work with both existing multi-device installations and newer combined monitoring setups.

    More Than Just a Healthy or Unhealthy Percentage

    The purpose of the report is not simply to display two percentages.

    Alongside the GO IAQS assessment, the report provides historical information that helps explain what happened during the reporting period.

    The report can include hourly historical values for parameters such as PM2.5, CO2, PM1.0, PM10, VOC, temperature, relative humidity and pressure.

    For PM2.5 and CO2, each hourly value can also be identified as Healthy or Unhealthy according to the applicable GO IAQS limit.

    This gives the person reviewing the report the ability to see both the summary result and the data behind it.

    For example, a report may show that PM2.5 exposure was healthy for 96% of the monitored period. The hourly data can then show exactly when the remaining 4% occurred.

    That can be especially useful when trying to associate an air quality event with cleaning activities, occupancy, ventilation problems, outdoor pollution, maintenance work or another event inside the building.

    Useful for Facility Management and Building Audits

    This type of historical reporting can be valuable in many professional situations.

    A facility manager can use the report to document indoor air quality performance in offices, classrooms, meeting rooms or other occupied spaces.

    A building operator can compare environmental performance before and after changes to ventilation or filtration.

    An indoor air quality consultant can include the report as supporting documentation when evaluating a building.

    An auditor can use historical exposure information alongside other evidence when reviewing indoor environmental performance.

    The report can also help HVAC professionals understand whether ventilation improvements have produced measurable changes in CO2 conditions.

    For universities and researchers, the same historical data can provide a structured way of reviewing indoor conditions over specific occupied periods.

    The important advantage is that the report is generated from continuously collected historical measurements, rather than depending only on a short manual measurement taken during a site visit.

    Generating the Report From the HibouAir Dashboard

    The report has been designed to be simple to generate.

    Users do not need to export thousands of measurements, build spreadsheets or manually calculate hourly averages.

    From the HibouAir dashboard, the user selects the relevant device or devices, chooses the reporting dates, defines the occupied hours and selects the days that should be included.

    The dashboard then processes the historical data and produces the GO IAQS assessment automatically.

    For installations using separate sensors, the user can select a CO2 device together with a particulate matter device. For HibouAir Duo installations, a single device provides both measurements.

    The resulting report brings the device information, reporting period, occupied hours, assessment limits, exposure percentages and historical data together in one consistent format.

    Supporting Environmental Parameters Add Important Context

    GO IAQS assessment in the current report focuses on parameters that have corresponding limits in the framework, such as PM2.5 and CO2.

    However, indoor air quality cannot always be understood from one or two parameters alone.

    HibouAir can also provide measurements such as temperature, relative humidity, VOC, pressure, PM1.0 and PM10, depending on the device.

    These values can be included in the historical section of the report as supporting environmental information.

    For example, increased CO2 may occur at the same time as changes in temperature and humidity as a room becomes occupied. Higher particulate levels may coincide with specific activities inside the room.

    Having several parameters available from the same monitoring system makes it easier to investigate these relationships.

    Part of a Wider Indoor Air Quality Monitoring Platform

    GO IAQS reporting is one part of the HibouAir dashboard.

    The platform is designed to help users move beyond simply checking the current sensor reading. Historical data, trends and analytical views make it possible to understand how indoor conditions change over time.

    This is important because many indoor air quality problems are temporary or recurring. A high CO2 level may only appear during certain meetings. Particulate matter may rise during cleaning or when outdoor pollution enters the building.

    Continuous monitoring captures those events even when nobody is actively watching the dashboard.

    The new reporting feature adds another layer by turning that historical information into a standardized and easier-to-share assessment.

    From Monitoring Data to Useful Documentation

    Collecting indoor air quality data is only the first step.

    For professionals responsible for buildings, the real value comes from being able to understand the data, identify problems and communicate the results to other people.

    The new GO IAQS Historical Exposure Report in the HibouAir dashboard helps bridge that gap.

    It combines continuous HibouAir monitoring with the GO IAQS framework to provide a clear view of PM2.5 and CO2 exposure during the periods that matter most.

    For facility managers, consultants, auditors, HVAC professionals and researchers, this makes historical indoor air quality data easier to use as practical documentation rather than simply another set of sensor readings.

    Share this post on :

    Contact Us

    Call us or simply fill out the form below, and one of our representatives will get back to you as soon as possible.